Analyzing the Popular Vote and Swing States, with a Focus on North Carolina
This blog is part of an ongoing assignment for Gov 1347: Election Analytics, a course at Harvard College taught by Professor Ryan Enos. Throughout the semester, we will explore historical election data and use it to forecast the outcome of the 2024 election.
For this week’s analysis, I focus on understanding the Democratic vote swing between the 2016 and 2020 presidential elections as these were the elections in which Donald Trump won and lost. I believe that this will help to enlighten which trends could have positive partisanship towards Kamala Harris in swing states. This shift, especially in states like North Carolina, plays a crucial role in defining future election outcomes. The map below illustrates how the Democratic vote share changed across key states between 2016 and 2020.
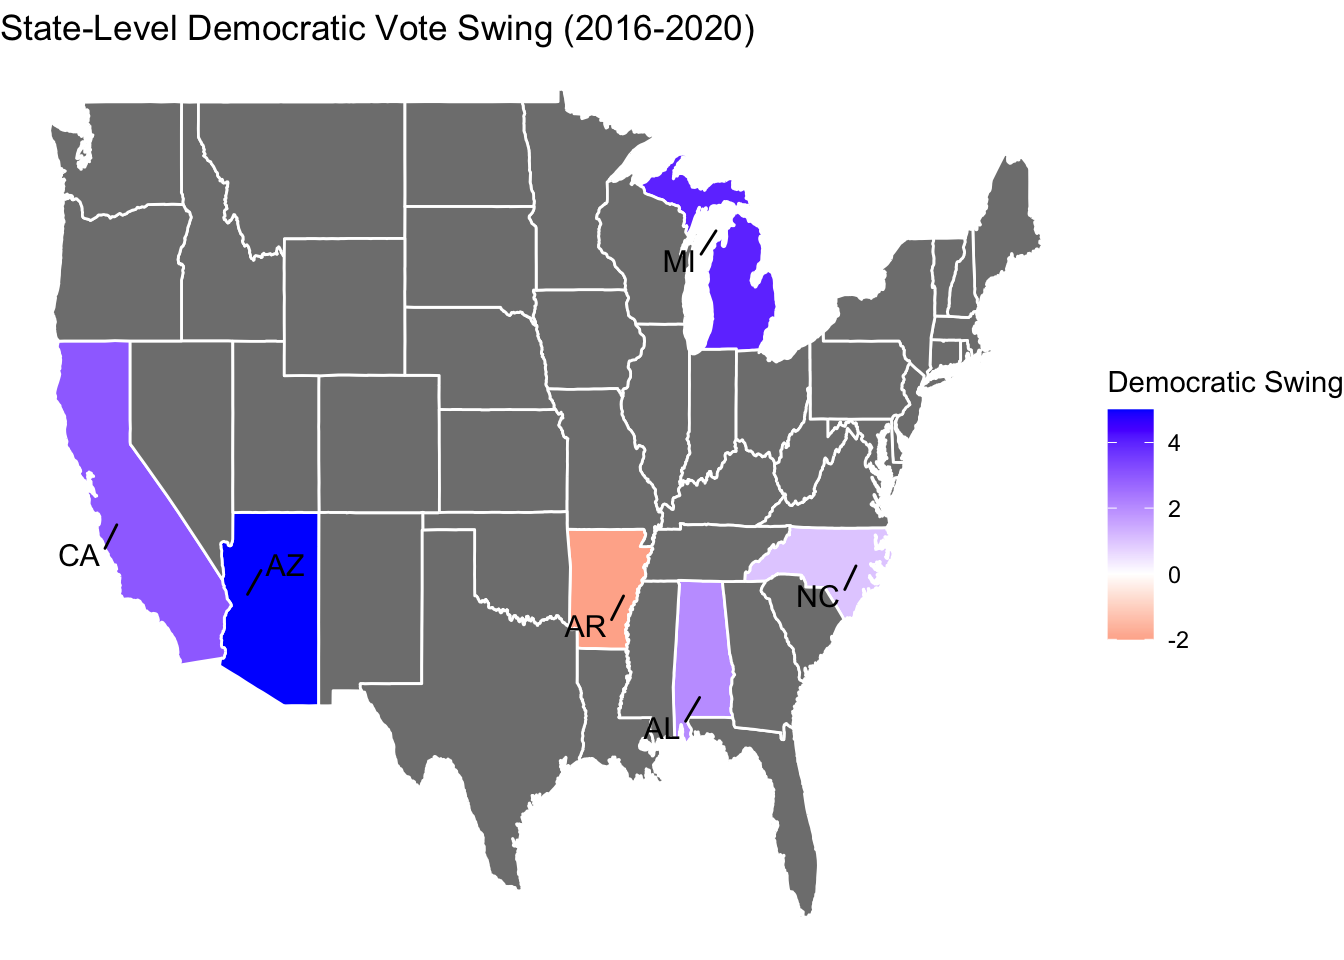
From the map, we can observe several key trends. There were significant Democratic gains in states like Arizona and Michigan in 2020, with both states shifting notably blue after voting Republican in 2016. California, already a Democratic stronghold, showed further consolidation of Democratic support in 2020. In contrast, states like Arkansas and Alabama continued to drift toward Republican candidates, although with smaller swings. The numeric scale shows the the percentage of increasing and the decreasing of democratic vote share in those swing states. This swing in favor of the Democrats is important for understanding the political environment leading up to 2024, particularly in the context of the 2020 election, where the electorate seemed to signal a desire for change after the tumultuous final years of the Trump presidency.
State-Level Popular Vote Analysis & Reasons for Change:
Looking at the 2016 and 2020 elections, we can see how state-level voting patterns have evolved. The two maps below illustrate the state winners for election years, highlighting changes in key battlegrounds.
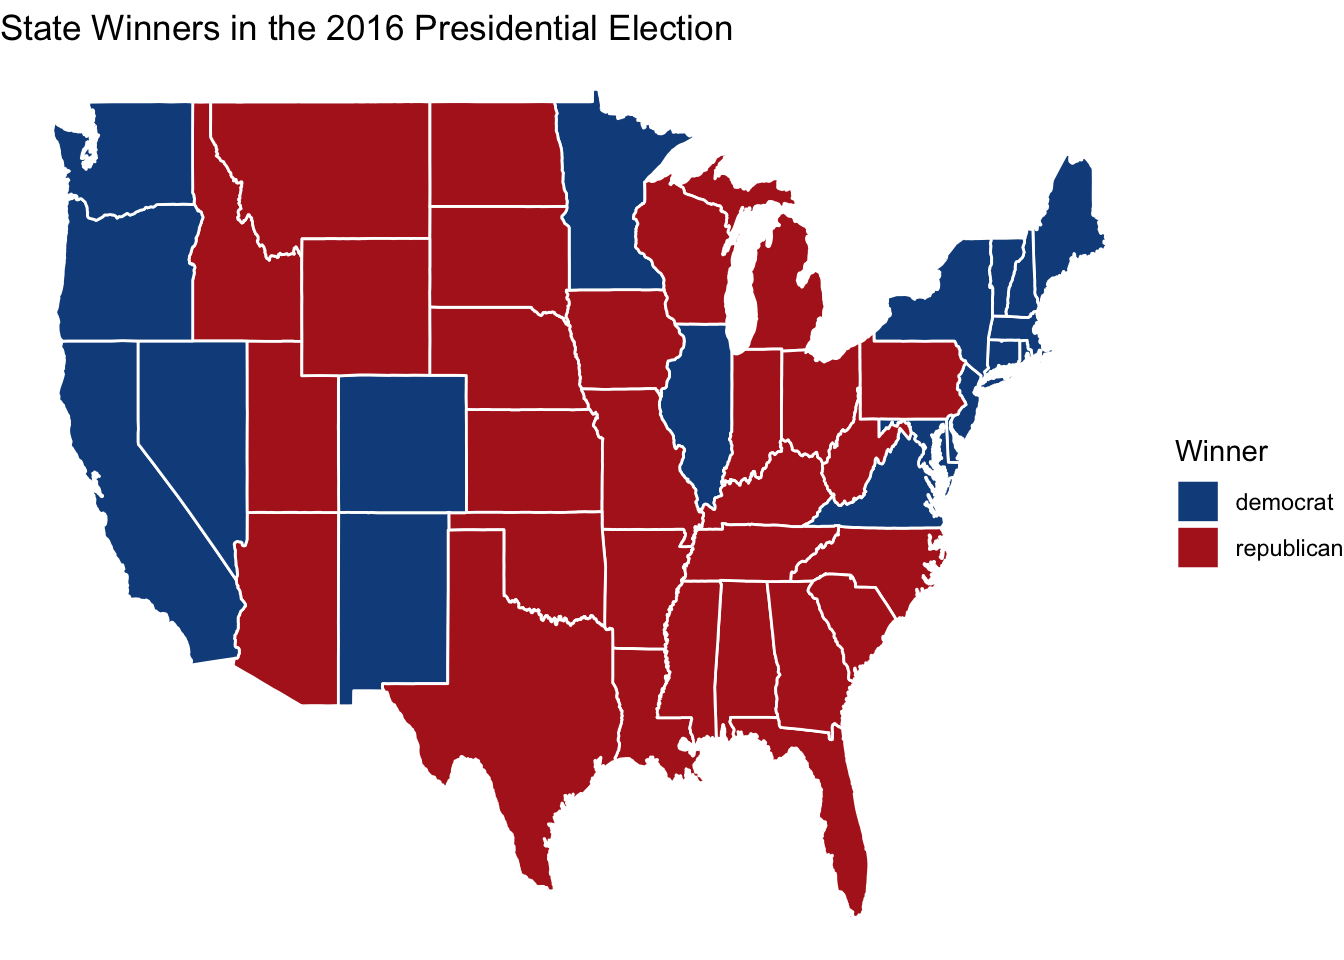
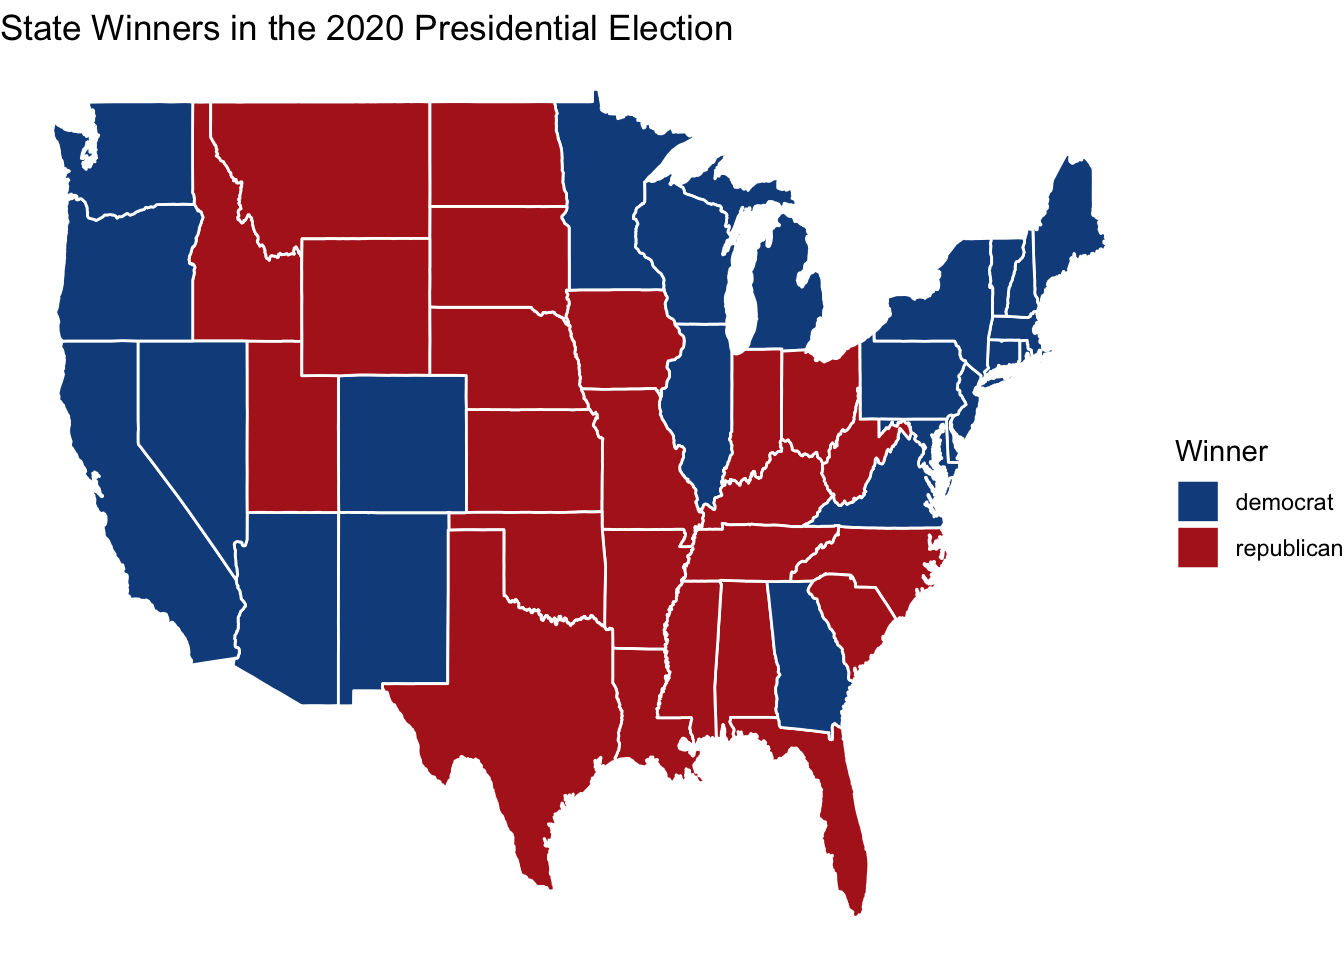
In both 2016 and 2020, states that traditionally lean Republican, such as those in the Deep South, continued to support the GOP. However, as we have established from the first image already quite a few states came back in for blue in 2020 but why.
The Democratic vote share saw significant spikes in certain cycles, notably in 1964, 2008, and 2020. The first assumption one might take when a party wins by a large popular vote or electoral college votes that there is a promise of economical wealth from the candidates. However, looking at the 1964 & 2008 democratic wins it was all about social changes as one was about desegregation while the other had the first African-American candidate, Barack Obama and he won over NC the same year. When Biden won in 2020, there were many issues such as COVID-19 in the previous presidency in which Trump didn’t handle the pandemic well enough. As we can track a certain pattern of important social events when the democratic party won by a high difference to its competitor was whenever their needed to be a change of morals and views within the US.
North Carolina: A Key Swing State
One of the most intriguing aspects of recent elections has been the performance of North Carolina, a state that has shifted between Democratic and Republican control. In 2008, Barack Obama won North Carolina, marking a major shift in the political landscape. By 2016, however, the state returned to supporting the Republican candidate, Donald Trump. In 2020, North Carolina remained in the Republican column, although the margin was narrow compared to other Southern states. The state’s urban-rural divide, along with its growing population in metropolitan areas like Raleigh and Charlotte, plays a significant role in this variability. Historically, as urban areas grow, they tend to lean more Democratic, which could tilt North Carolina blue in future elections. However, the small Democratic vote swing in 2020 reflects a broader trend in North Carolina’s urban areas, where an increasing number of young and diverse voters are moving the state closer to the Democratic column. The balance of power in this state will continue to be crucial for future elections, particularly as its urban and suburban areas grow in population.
Public Opinion in 2024: Harris vs. Trump:
Recent polling data from April to August 2024 sheds light on the evolving dynamics in the race between Vice President Kamala Harris and former President Donald Trump. The graph below tracks public opinion polls during this period:
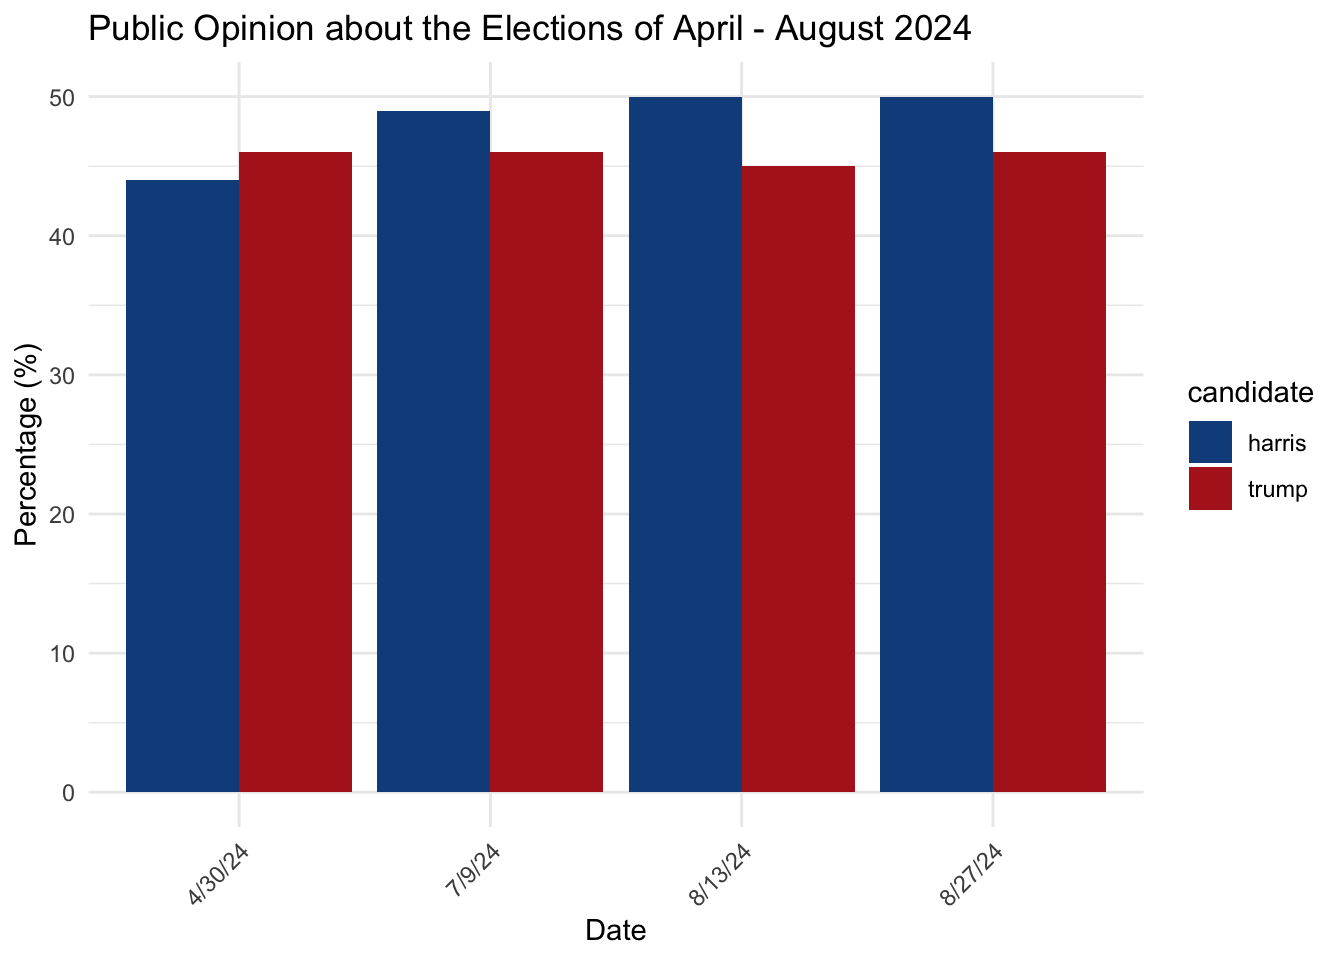
As of late August 2024, Harris holds a slight lead over Trump, with 50% of the vote compared to Trump’s 46%. Interestingly, a movement within the Republican Party known as “Republicans for Harris” has gained traction, with 131 delegates expressing their support for Harris at the DNC. This factionalism could further complicate the GOP’s efforts in swing states like North Carolina, which will make the upcoming election even more intricate.
Could North Carolina Swing Blue Again?
Given North Carolina’s history as a battleground state, it is possible that it could shift back to the Democratic column in 2024. Key factors include:
Urbanization: North Carolina’s metropolitan areas are expanding rapidly, and these areas tend to vote Democratic. If voter turnout in these regions is high, it could tip the balance toward Harris.
Republicans for Harris: The support for Harris from key Republican figures may signal a weakening of the GOP’s traditional coalition, particularly in swing states.
Past Voting Patterns: In 2008, North Carolina went blue, but returned to the Republicans in 2016 and 2020. The state’s electoral history demonstrates that it remains competitive, making it a critical battleground in 2024.
Conclusion: The Future of North Carolina in Presidential Elections:
North Carolina stands as a pivotal swing state whose political future is tied to national trends and movements within both major parties. Understanding how the popular vote and local dynamics evolve will be crucial for predicting the outcome of the 2024 election. As we have previously gathered that the democratic party won the popular vote share when their was a change needed. So far in a study by Morning Consult from late August it shows that in North Carolina almost match the nationwide favor of Harris with a 49% while Trump has 47%. As we continue to analyze the data, I will delve deeper into the demographic and electoral shifts within North Carolina and other key swing states, using both historical and current polling data to inform predictions.
Sources: The data was taken from congressional district level U.S. House election results, 1948-2020 & ABC News/Ipsos Polling.