The Economy and Electoral Outcomes: Understanding the Link Through Third Quarter GDP Growth and Unemployment
This blog is part of an ongoing assignment for Gov 1347: Election Analytics, a course at Harvard College taught by Professor Ryan Enos. Throughout the semester, we will explore historical election data and use it to forecast the outcome of the 2024 election.
In American presidential elections, economic performance has long been considered one of the most significant factors influencing voter behavior. This year is no different, as the state of the economy will likely be a decisive factor in shaping the outcome of the 2024 election. Economic indicators such as GDP growth and unemployment rates, particularly in the months leading up to the election, offer insight into how voters may judge the incumbent party. At least that’s the average believe, that economy determines whether a party succeeds in the election or looses.
In this blog post, I will examine the relationship between third-quarter GDP growth and unemployment rates and if these factors correlate with the incumbent party’s share of the popular vote.
GDP Growth and Popular Vote Share:
GDP growth, particularly in the third quarter, is commonly seen as a measure of economic health that can significantly influence voters’ decisions. Historically, stronger GDP growth was assumed to be associated with higher vote shares for the incumbent party, while weaker or negative growth signaled trouble. However, this graph suggests a different story.
In the plot below, the relationship between third-quarter GDP growth and the incumbent party’s national popular vote share appears to be negative, contrary to conventional expectations. This means that, surprisingly, higher GDP growth in the third quarter correlates with a decrease in the incumbent party’s vote share.
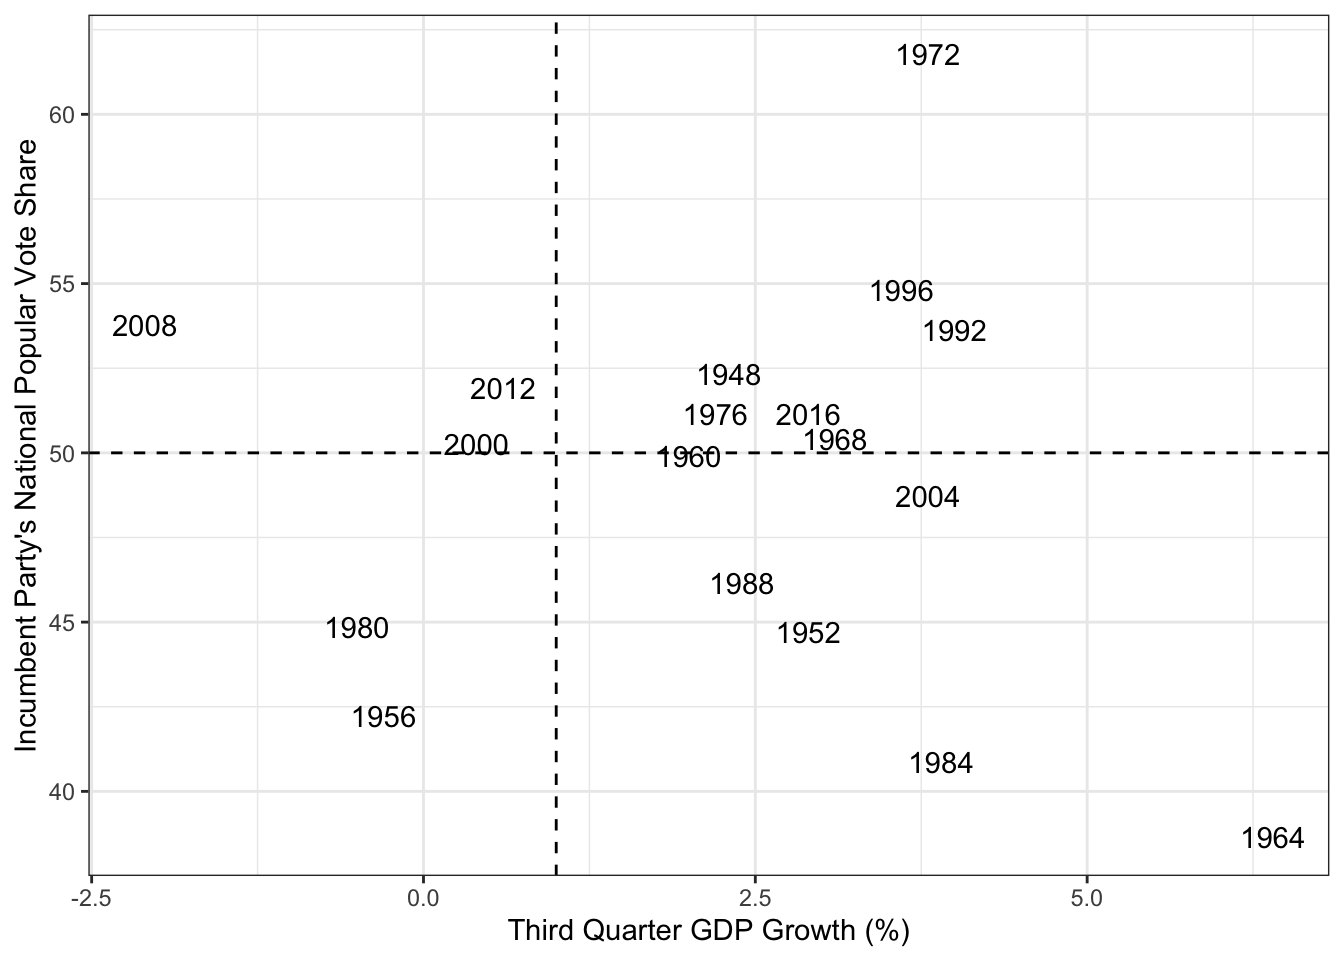
The graph reveals that incumbents do not necessarily benefit from higher GDP growth. For example, even when GDP growth exceeds 1% (indicated by the vertical dashed line), the vote share does not always rise above 50% (the horizontal dashed line). This observation suggests that voters may weigh other factors more heavily than economic performance when casting their votes.
Achen and Bartels (2017) argue that voters only start to pay close attention to economic conditions in the third quarter of the election year. Yet, our revised plot indicates that even a growing economy does not always secure an incumbent victory. While the second quarter GDP rose by 3%, a positive economic indicator, this analysis shows that factors beyond GDP growth—such as social issues, candidate appeal, or external crises—play crucial roles in election outcomes. I would even argue that in most cases people use the economical reasoning as a mask to hide that mostly people vote for the candidate that they can most identify with. Therefore, voters do not look at the economy nor at policies as much as they would like us to think. No, they use heuristics (mental shortcuts) to make big decisions: whether they like a candidate more, they think the candidate is more charismatic than the other, or feel more represented by the rhetoric of a candidate.
The Role of Unemployment:
Unemployment is crucial indicator of economic performance and voter sentiment, right? Rising unemployment can signal economic distress, often diminishing public confidence in the incumbent government. For example the sudden rise of unemployment rate inApril 2020 due to COVID-19, 14.4% to be specific, was big hit for the Trump admission as I would claim this was one of the big social waves to change outcomes of the 2020 presidential election.
Below is a scatter plot depicting the relationship between unemployment and the incumbent party’s popular vote share:
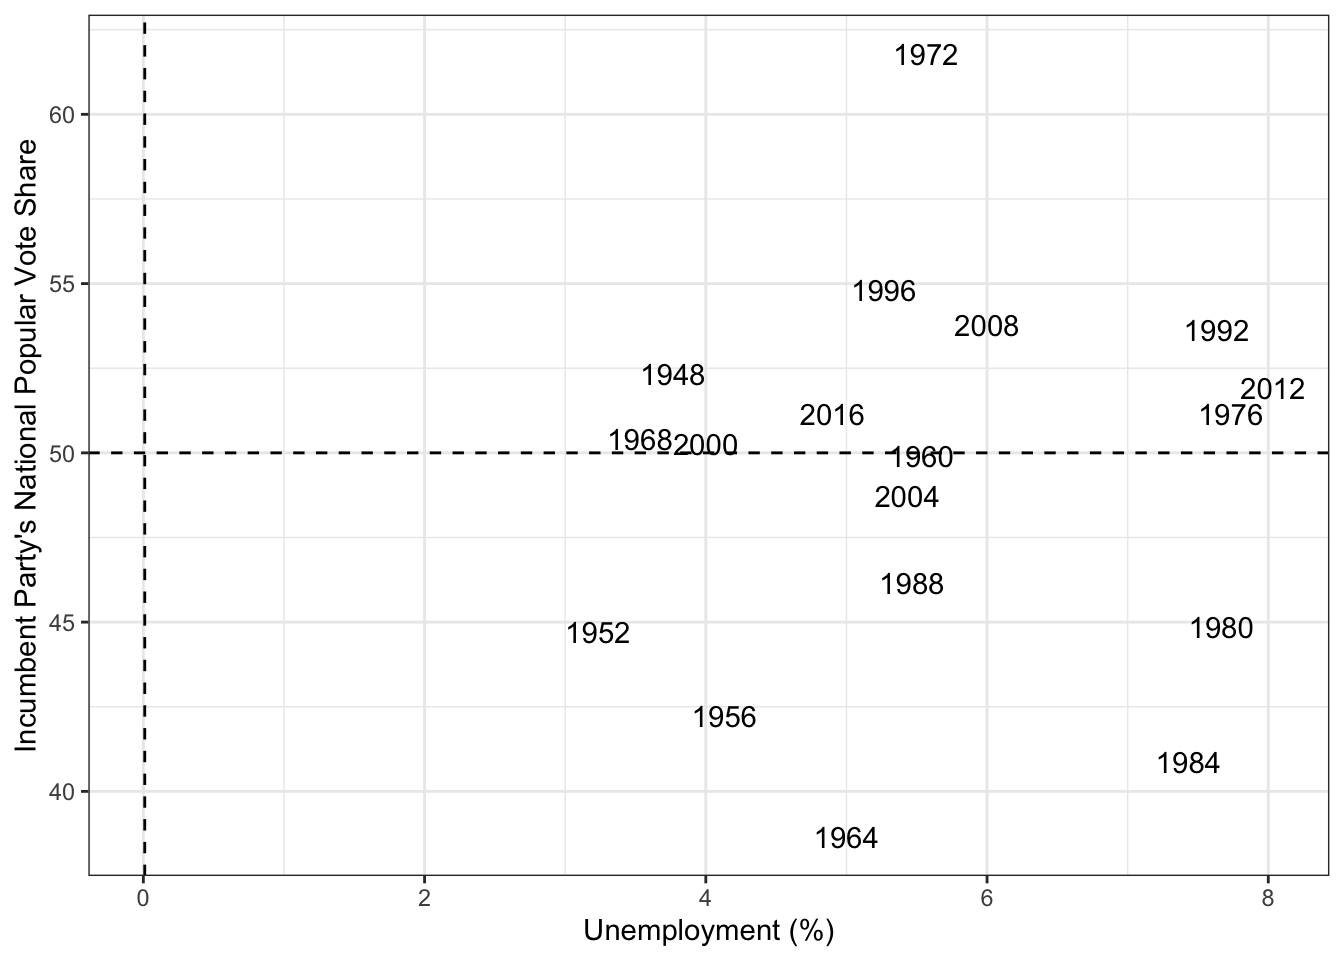
We observe that while there may be a general trend (higher unemployment correlating with a lower vote share for the incumbent), the relationship is not very strong or consistent. In other words, there may be other factors influencing the vote share besides unemployment. Does this indicate that maybe the economy is not an important factor when deciding on who to vote for but maybe just a trap.
Adding a Regression Line: GDP Growth as a Predictor:
To quantify the relationship between GDP growth and the incumbent party’s vote share, we can fit a linear regression model. This allows us to estimate the effect of GDP growth on electoral outcomes. The equation for the fitted model is:
Y=49.99-0.302X
Where Y represents the incumbent party’s vote share, and X is the third-quarter GDP growth:
##
## Call:
## lm(formula = pv2p ~ GDP_growth_quarterly, data = cleaned_q3_filtered)
##
## Residuals:
##     Min      1Q  Median      3Q     Max
## -9.4005 -4.0769  0.9392  2.7934 12.9470
##
## Coefficients:
##                      Estimate Std. Error t value Pr(>|t|)
## (Intercept)           49.9901     2.0790  24.046 5.49e-14 ***
## GDP_growth_quarterly  -0.3021     0.6854  -0.441    0.665
## ---
## Signif. codes:  0 '***' 0.001 '**' 0.01 '*' 0.05 '.' 0.1 ' ' 1
##
## Residual standard error: 5.75 on 16 degrees of freedom
## Multiple R-squared:  0.012,	Adjusted R-squared:  -0.04975
## F-statistic: 0.1943 on 1 and 16 DF,  p-value: 0.6653
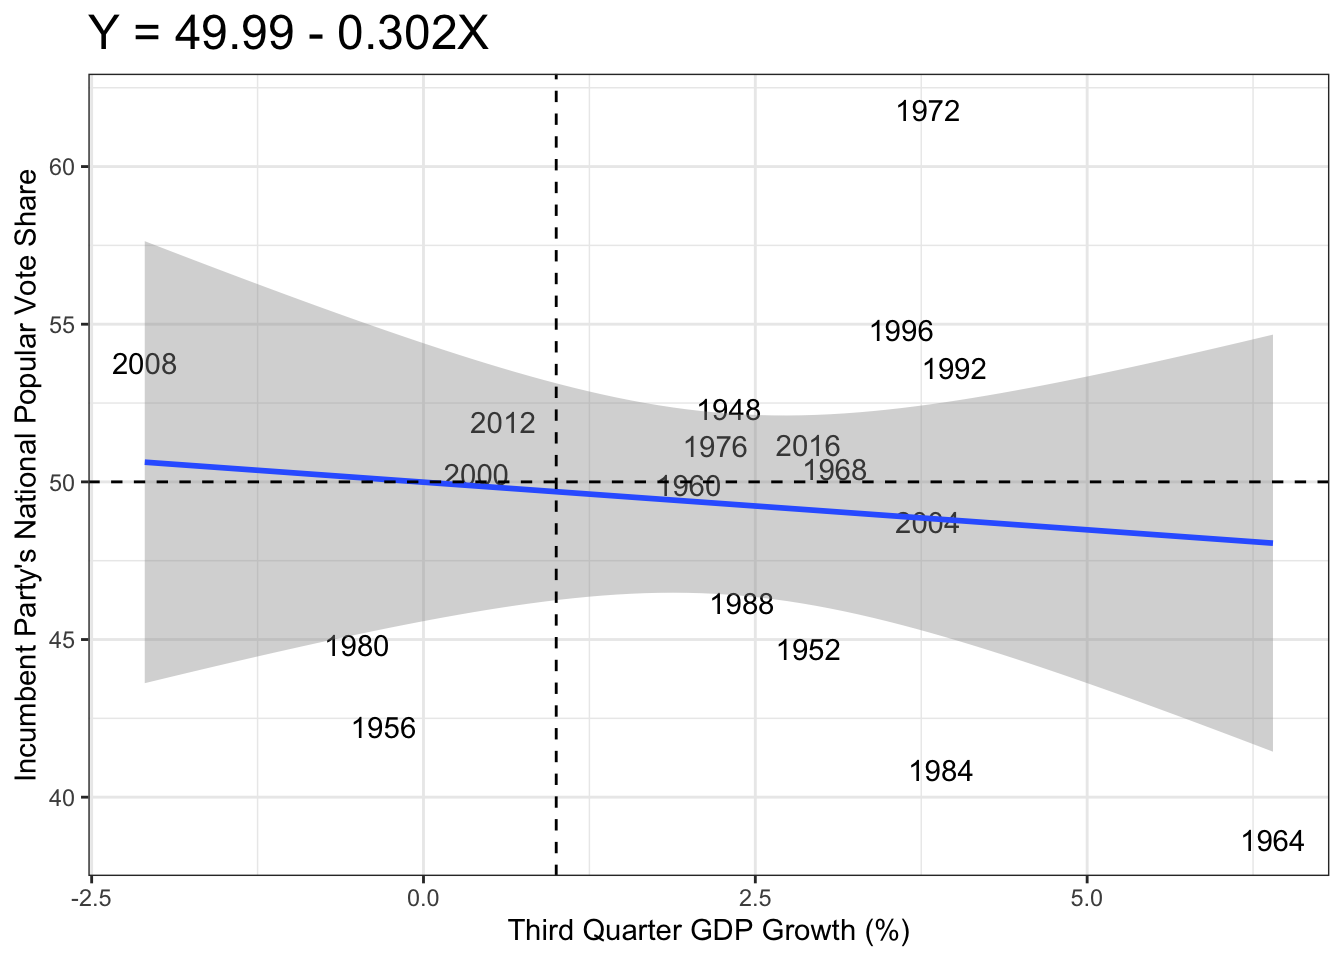
This negative slope indicates an inverse relationship between GDP growth and the vote share. Surprisingly, the model suggests that as GDP growth increases, the incumbent party’s vote share tends to decrease. Specifically, each percentage point increase in GDP growth correlates with approximately a 0.3% decrease in the incumbent party’s vote share.
This negative relationship challenges conventional belief, which often assumes that stronger economic performance would benefit the incumbent party. However, the variability in the data suggests other factors may also be at play in determining electoral outcomes, making this an area for further exploration.
The regression line on the plot visually highlights this inverse relationship, where higher GDP growth values are associated with lower vote shares for the incumbent party.
Conclusion:
“It’s the economy, stupid!” as Bill Clinton famously claimed during his successful candidacy in 1992, which was a great rhetorical strategy to make the voters focus mainly on the economy. I do believe that the economy does play a role for people but apparently the few months before the election (third quarter) are not the main role to decide which candidate to vote for as Achen & Bartle might suggest. As we approach the 2024 election, there comes an uncertainty of economic indicators and if they play a pivotal role in shaping public sentiment and ultimately, the election outcome. If we are to trust the current quarter then the incumbent party and with that Harris might have a shot becoming the first female president of the United States. However, as the data shows, while economic fundamentals can be important during some election more than others, they are not the sole determinants of electoral success—other factors do play a huge role, leading to surprising results in certain years.